GUI
One of most distinctive paradigms behind rin is that although it's main entry point, the way it's mostly used, is through code, the gui is a first class citizen. Let's compile the previous example, immediate_renderer in the examples repository but in this case let's enable the gui.
To do that we can use cargo features:
cargo run --features=gui
The application will now show a gui in the left side of the window. In rin every bundle we add to our application can easily add a gui which makes it really convenient to adjust certain parameters that would take a lot of tweaking to do via code.
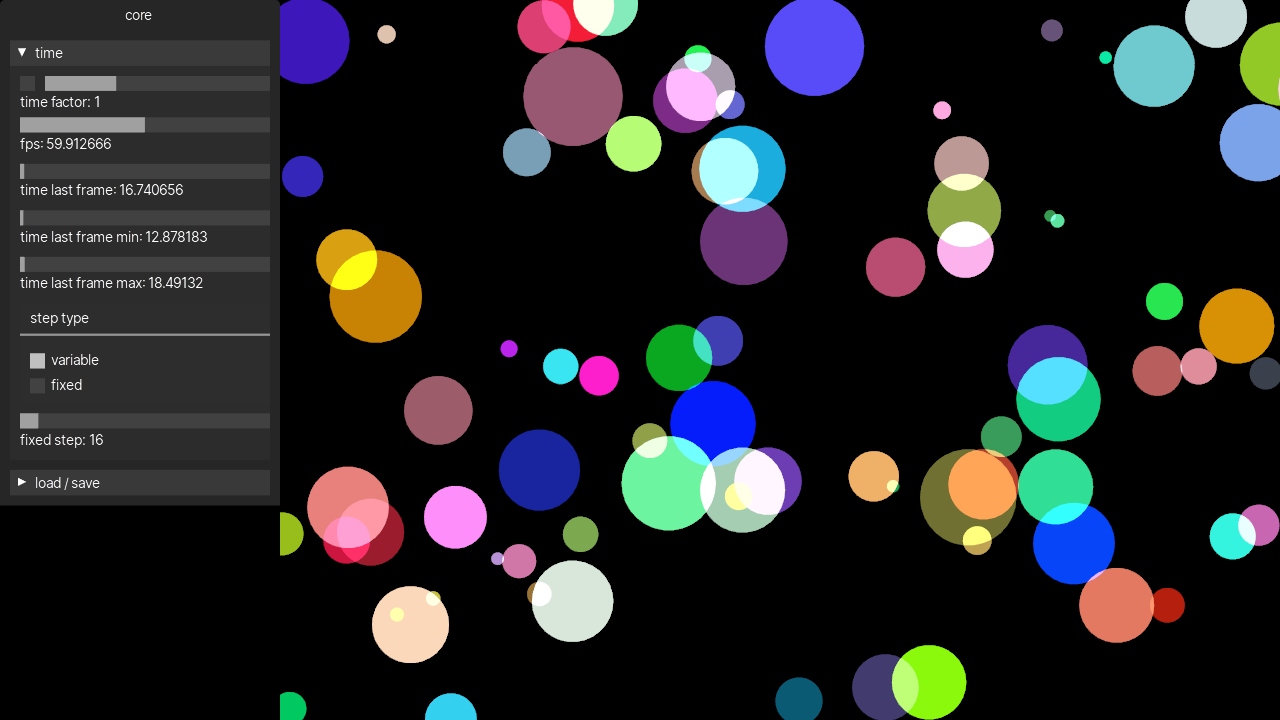
The first tab core contains the gui for the rin core. There you can find for example time information and adjustments that are really useful when working with animations.
For example adjusting the time factor we can change the speed at which the circles move. This panel also show the current fps of the application, the last frame time and the last minimum and maximum frame times in the last second which are useful to check he application is running in real time without problem.
In the time panel we can also find a step type and a fixed step slider. With the normal step type, variable, the clock will return the real time but if we choose fixed and a fixed step time, it'll always return that time in ms for every frame. This is really useful when working with non real time applications to save recordings that are timed correctly when played back.
Apart from the time panel there's also a panel to load and save the application settings from the gui including a slider to "travel back in time" through all the changes we've ever done to an application.
You usually won't need to save settings manually since the gui takes care of saving the settings anytime a control is changed but you can also save a settings file from the load/save panel using the path textbox and the path navigator to select the folder where to save the settings.
If we now run the basic_example in the core tab we'll get some debug info from the renderer showing the number of active materials and programs which is useful to optimize applications.
A second tab postprocessing that comes from the postprocessing bundle that is added in the setup of this example. There we can enable and adjust different postprocessing effects. Like bloom, SSAO, depth of field, tone-mapping... To understand better the different postprocessing effect options, check the documentation of the postprocessing module.
Stats
Another useful feature in rin is the stats feature to enable it again let's go back to the immediate_renderer example and let's compile it enabling the stats and gpu_stats features along with the gui.
cargo run --features=gui,stats,gpu_stats
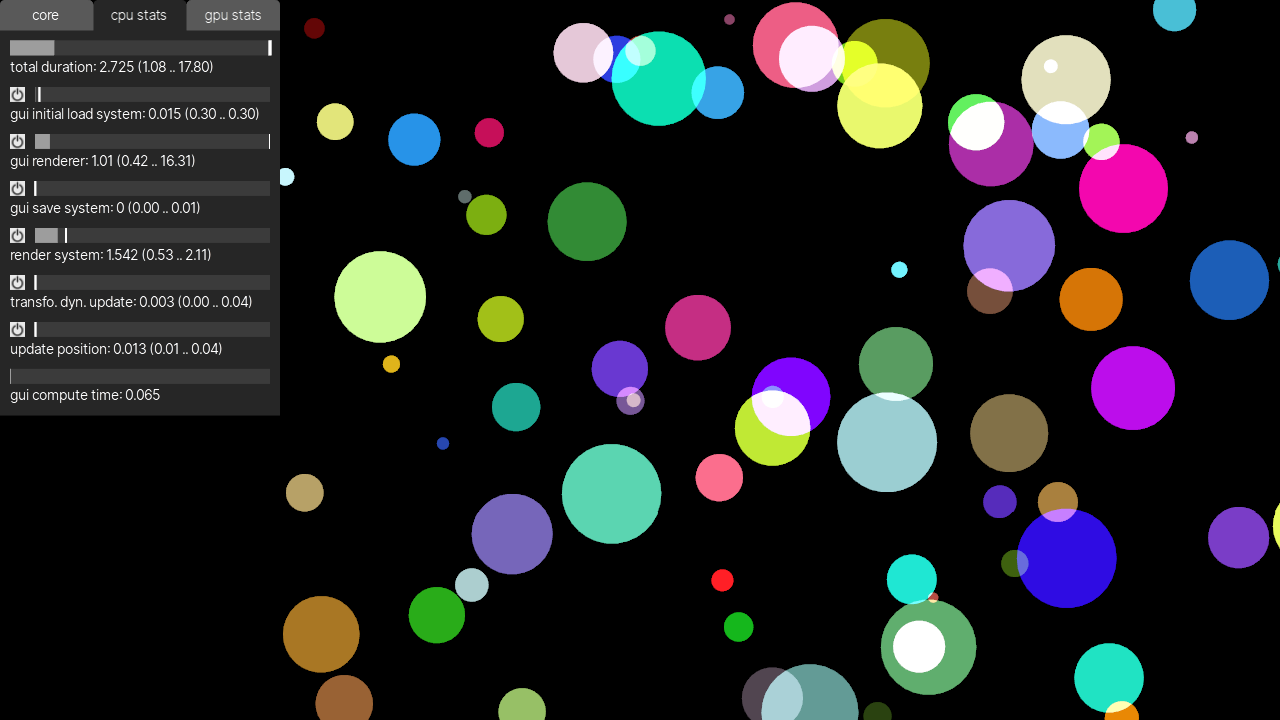
Now we can see two new tabs, cpu stats and gpu stats there we can see every system running in our application and how long they take to run every frame. The main value is filtered over several frames and the ticks in the slide and the range in the value for each system indicate the minimum and maximum times each system took to run in the last second. The filtered value is useful to quickly see which systems take longer to run so we can optimize where it matters. The minimum and maximum values let us see outliers in systems that might only eventually run and that might take excessively long but the real value would get hidden because of the filtering.
In the immediate_renderer example we'll see several systems, all related to the gui rendering but not our own. In order to show our own systems we need to give the a name. To do that in the app.rs file, above each of the system functions declaration we can add:
#[update_system(name = "update velocity")]
fn update_velocity(clock: &Clock, entities: Entities, resources: Resources) {
To the update velocity function, and the in the render system function:
#[render_system(name = "render system")]
fn render_system(
The #[*_system] syntax allows to annotate the different systems with a name and more options that we'll see in next chapters. If we run now the example we'll see in the cpu stats the times for each of the systems with the render system being the one that takes more time. In the gpu stats tab, we'll only have the gui renderer and our own render system, since that's the only two systems that currently run on the gpu.
Until now we've been running our application in debug mode cause it's faster to compile and also allows us to use a debugger if needed. That makes the stats times really high. To compile the application in release one can use:
cargo run --features=gui,stats,gpu_stats --release
When profiling an application is usually recommended to use the release profile.
the stats feature also allows to temporarily pause certain systems in our application. In the cpu stats tab we can press on the button next to each slider to pause and resume the execution of any system in the application.
The stats feature also provides a way to export a view of a full frame and how the systems are running during that frame. To do that we can use the method export_tracing_stats in the scene. The saved file can be seen in chrome or chromium by opening the url: about://tracing and from the opening the saved file.
To test it let's open the main.rs file of the immediate_renderer example and first of all add the necessary imports. At the top of the file we add:
use rin::prelude::*;
use rin::window;
Then before the while !should_close loop:
#[cfg(feature="stats")]
let mut ctrl_s_pressed = scene
    .event_stream()
    .keys()
    .pressed_with_mods('s', window::KeyModifiers::CONTROL)
    .map(|_| ())
    .to_property_last_value(());
Which will create a PropertyLastValue that we can query to know if Ctrl + s has been pressed. Then inside the loop on the last line we add:
#[cfg(feature="stats")]
if ctrl_s_pressed.last_value().is_some() {
    scene.export_tracing_stats("stats.json");
}
Which will save the current frame tracing statistics to stats.json file. If we now run the example again and press Ctrl + s we'll get a stats.json file that when opened in chrome show something like:
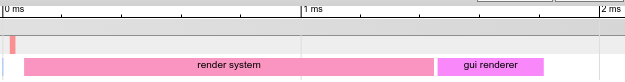
Which shows how the update velocity system runs first for a very short period of time and then the render system and gui renderer which take longer. They are on different rows because they run on different threads. We'll show in later chapters how certain systems run in parallel in different threads.
Clicking on each of the bars will show information about each system including, it's start and end times and it's duration.
Bundles GUI
Rin Bundles can very easily add their own parameters to the gui. When adding a bundle to the scene if it provides any parameter it will automatically show up in the gui. We've already seen them when compiling the basic_example where the postprocessing bundle adds it's parameters to the gui. Let's try adding an external bundle, for example the inspector bundle from the rin_inspector crate.
First of all let's add the crate to the immediate_renderer example. Inside it's directory, from the terminal:
cargo add rinecs_inspector --registry rin_rs
Now at the beginning of the setup functiom, for example right after adding the update_velocity system let's add:
scene_builder.add_bundle(rinecs_inspector::Inspector::new());
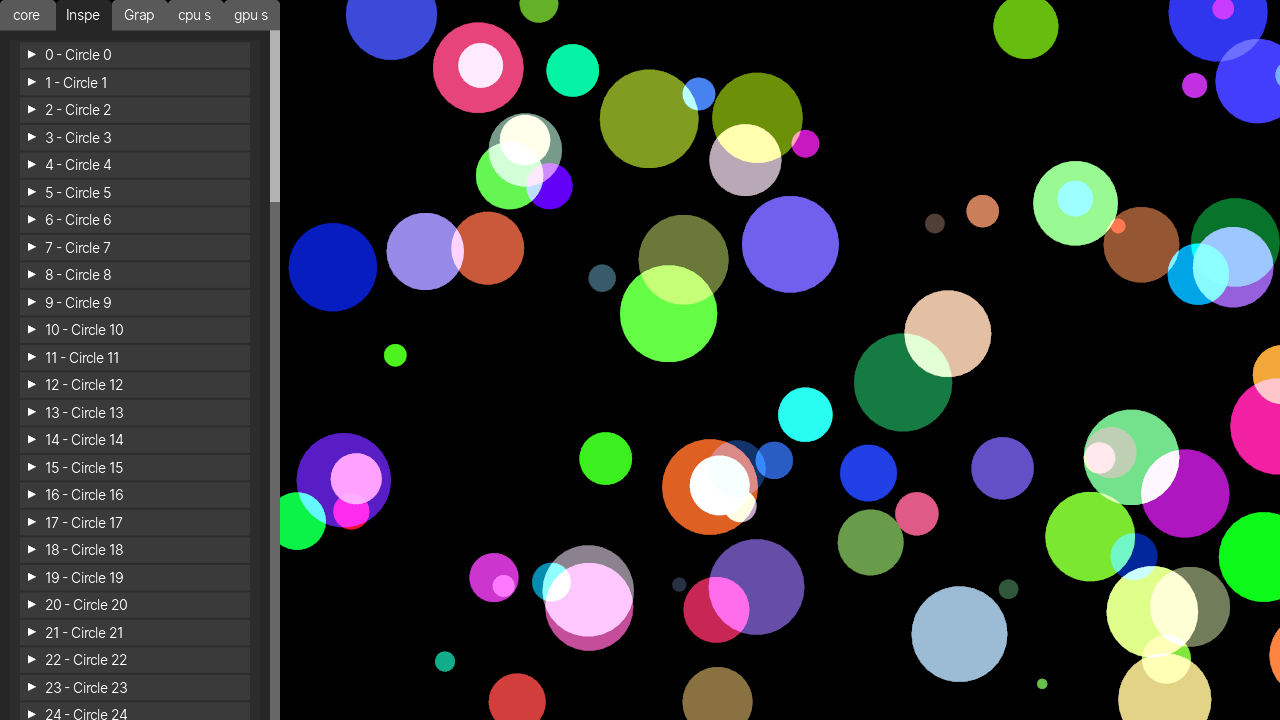
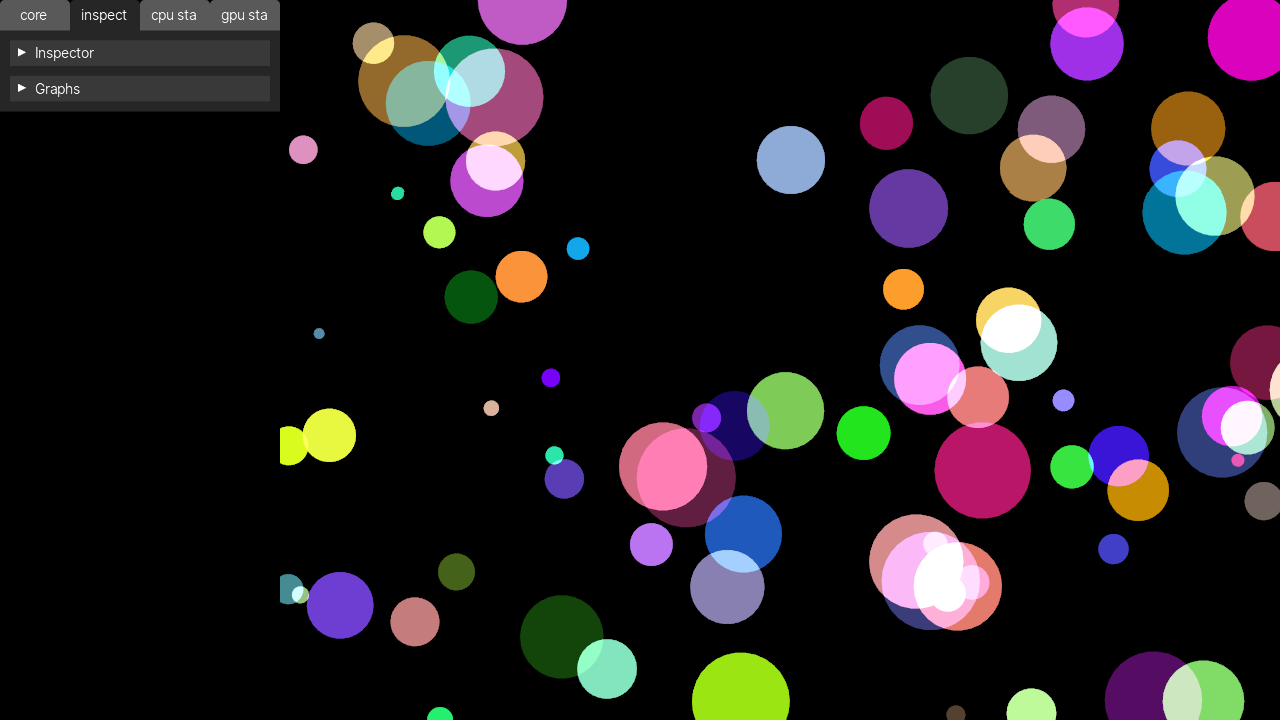
Now if we run the project again we'll get two new tabs in the gui, in the first one, inspector, we get a panel for each entity in the scene, if we unfold any of them we can see all the components that entity has. When entities have a Name the inspector will show it as well. Let's add it to see how it works, to do so we change the for loop that adds all the entities in setup to:
for i in 0..100 {
    scene.new_entity()
        .add(Name(format!("Circle {}", i)))
        .add(Position(pnt2(rand::random::<f32>() * w, rand::random::<f32>() * h)))
        .add(Size(rand::random::<f32>() * 90. + 10.))
        .add(Velocity(vec2(rand::random::<f32>() * 20. - 10., rand::random::<f32>() * 20. - 10.)))
        .add(Color(rgba!(rand::random(), rand::random(), rand::random(), 0.1)))
        .build();
}
When we now run the application, the inspector panel shows the right name for each circle.
The second tab graphs, can be used to show the progression of a certain value. If we go in the inspector tab and unfold the position of any of the circles, next to the x and y components there's a button with the icon of a graph. Pressing it we create a graph in the graphs tab that will show the progression of that value over time.
Finally, when adding bundles in a complex application the number of tabs in the main gui can get too high and be really difficult to use. To avoid that problem we can group several bundles in one tab. For example we can change the line that adds the inspector to:
scene_builder.add_bundle_to_group(rinecs_inspector::Inspector::new(), "inspector");
And now both of the inspector tabs go into one as foldable groups. If we added any other bundle to the group "inspector" it would also be added to the same tab.
The bundles chapter shows among other things how to create a gui for our own bundles.